Decoding Motor Efficiency Ratings: What They Really Mean
Learn how IE and NEMA efficiency labels are tested, what they omit at partial load and with VFDs, and how to turn ratings into real energy savings.
What an Efficiency Rating Measures
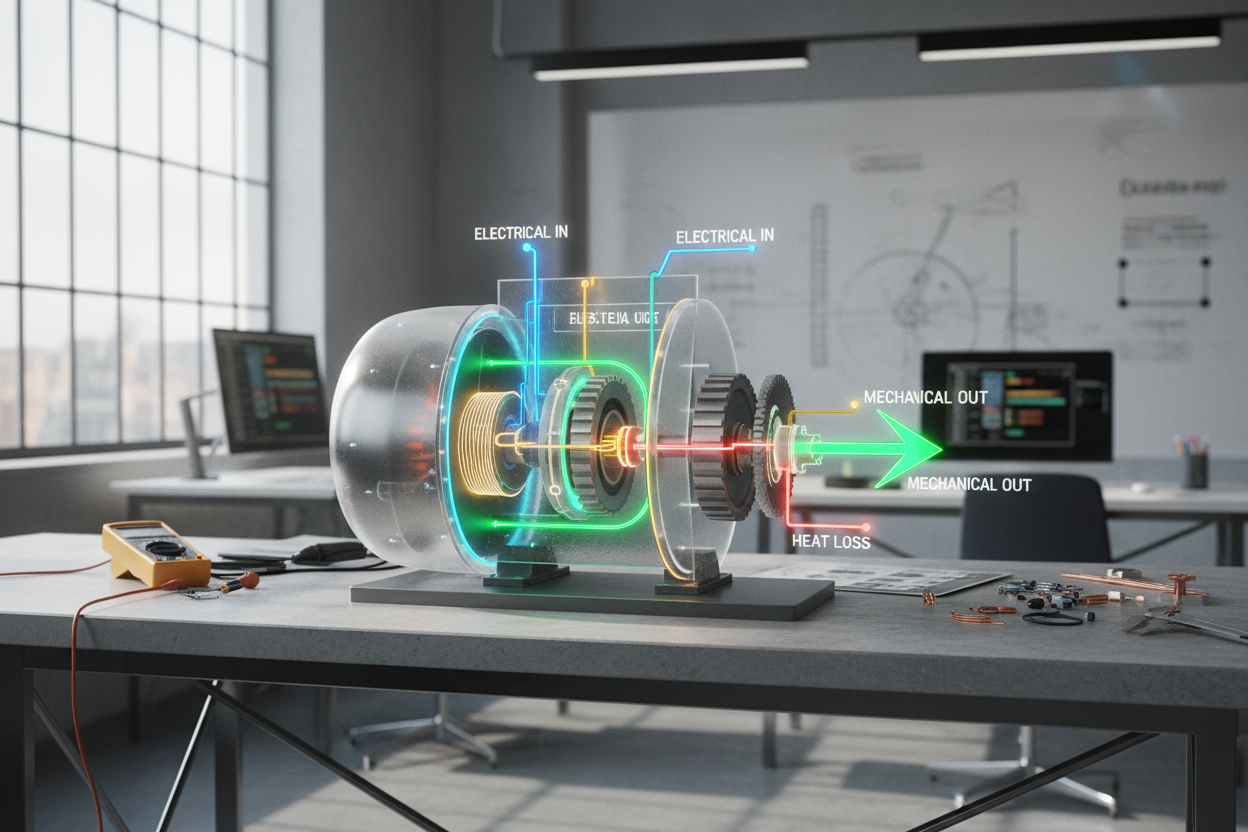
Motor efficiency is simply the ratio of output power on the shaft to input power from the electrical supply, expressed as a percentage. A higher efficiency means less energy is wasted as heat and more is converted into useful mechanical work. Losses come from several sources: stator copper losses, rotor losses, core (iron) losses, friction and windage, and stray-load losses. Test labs measure efficiency at defined conditions, including voltage, frequency, and temperature, so the rating reflects a controlled baseline rather than every real-world situation. Two motors with the same horsepower can show different efficiencies because of design choices like lamination quality, slot geometry, fan design, and bearing selection. Remember, efficiency tells you how well a motor converts energy, not whether it will meet your application's torque-speed demands or handle your duty cycle. It is a critical pillar of performance, but it must be evaluated alongside power factor, thermal class, and enclosure to ensure the motor matches the job and environment.
Standards, Classes, and Nameplate Nuance
Efficiency ratings are often grouped into international efficiency classes such as IE1, IE2, IE3, and IE4, with higher classes indicating better performance. These classes align with standardized test methods, giving buyers a consistent basis for comparison. On a nameplate or datasheet, you may see nominal efficiency, which represents a typical value, and understand that standards allow certain tolerances in testing. Be careful not to confuse power factor with efficiency; power factor describes how effectively current contributes to real power, while efficiency focuses on converting input watts into mechanical output. Ratings are usually determined at full-load, but some manufacturers provide part-load efficiency points that reveal how the motor behaves across its operating curve. Also note attributes like service factor, which indicates short-duration overload capability, but does not imply the motor should be routinely run above its rated load. Interpreting all these details together helps you judge both energy performance and practical suitability.
Load, Control, and Real-World Performance
Few motors run exactly at full-load all the time. Efficiency typically peaks near a high load fraction, then falls as the motor is underloaded. Chronic oversizing wastes energy, increases upfront cost, and raises idle losses. Conversely, undersizing risks overheating and premature failure. For pumps and fans with variable torque profiles, pairing a motor with a variable frequency drive (VFD) can dramatically cut energy use by matching speed to demand. However, VFDs introduce harmonics, additional stator heating, and potential bearing currents; mitigation may require inverter-duty windings, insulated bearings, dv/dt filters, or proper cable practices. Real installations also face voltage unbalance, dirty power, and ambient temperature swings that shift performance away from lab ratings. Seasonal or process-driven duty cycles change the optimal selection and control strategy. Understanding the application's load profile, start-stop frequency, and required torque-speed behavior ensures the efficiency rating translates into real savings instead of just a promising number on paper.
Cost, Payback, and When Upgrades Make Sense
While the purchase price grabs attention, life-cycle cost is dominated by electricity. Even small percentage gains in efficiency can deliver substantial savings when a motor runs many hours. Estimate annual energy by multiplying input power at typical load by operating hours and electricity cost, then compare alternatives to find payback. A right-sized, high-efficiency motor often pays for itself quickly in continuous or near-continuous service. If you're choosing between rewinding and replacing, note that poor-quality rewinds can degrade efficiency, while skilled processes can preserve it; evaluate based on motor size, remaining life, and expected duty. Consider the system too: fixing throttling losses, reducing mechanical friction, repairing leaks, and optimizing impeller or fan selection often yields bigger savings than a motor swap alone. Where controls are needed, a VFD enables speed reduction rather than wasteful throttling. Combine equipment upgrades with predictive maintenance to protect efficiency gains and extend asset life.
Reading Curves and Making Smarter Selections
Beyond a single number, study the efficiency curve versus load, torque-speed curve, and temperature rise. Look for strong breakdown torque and appropriate slip for your process dynamics. Confirm the service factor and use it sparingly to handle infrequent overloads, not as a new normal. Match the enclosure (e.g., TEFC or ODP) and IP rating to the environment, since dust, moisture, or chemicals affect cooling and longevity. Check insulation class and bearings suited for VFD duty if speed control is planned. In operation, monitor voltage balance, current, power factor, vibration, and temperature to detect deviations that erode efficiency. Log typical load levels and size the motor so it operates near its high-efficiency region. Favor models with verified IE class performance and clear part-load data. By combining accurate measurements, honest duty profiling, and disciplined selection, you convert an abstract efficiency label into dependable, bankable performance in real motor-driven systems.